Forest Sampling Designby Ray GranvallCascade Appraisal Services, Inc.
Clients frequently call upon Cascade Appraisal Services, Inc. (Cascade) to conduct timber cruises and often, such cruises are on fairly large tracts. Cascade is therefore most interested in improving cruising efficiency but not at the expense of accuracy and reliability of results. Typically, Cascade employs a sampling methodology that utilizes variable plots spread over a systematic grid with alternating count and grade plots. Recently, we were presented with a cruising opportunity that enabled us to investigate and compare several sampling systems. We designed the cruise as a simplified experiment to address sample size and varying sampling methods. The cruise was specifically planned to compare results from five different variable plot-sampling systems with respect to volume and value. Dr. Kim Iles’ Optimum Program was used to determine the number of cruise plots that would be needed based upon our estimate of coefficient of variation (CV) and tree count. For comparative purposes the experimental cruising results were tested against the standard Cascade sampling method. A specified set of parameters was described for each of the five sampling systems to be used. The sampling systems were defined as follows:
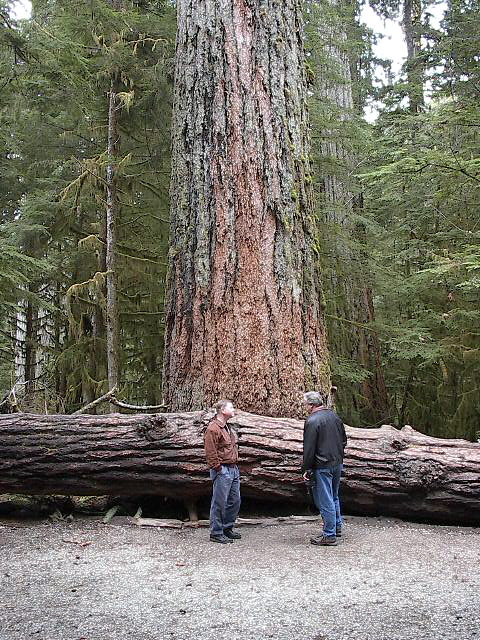
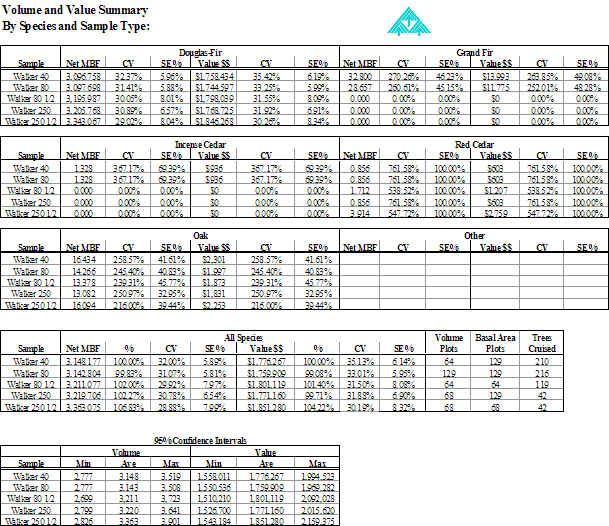
The test property was a small parcel of approximately 468.08 acres (± 189.43 Hectares) located in Lane County, Oregon east of the City of Eugene and about 3 miles (± 4.8 Kilometers) north of the Town of Oakridge. The merchantable timber stands were comprised almost entirely of young growth Douglas-fir in the 40-50 year age class and second growth Douglas-fir in the 60-70 year age class. Minor species found on the property include incense-cedar, western redcedar and Oregon white oak. The value of these minor species is inconsequential (± 1%). They do however provide an interesting example of the effect of sample methods and intensities on minor species. The initial cruise specifications estimated ± 121 plots in total. Actual established plots in the field totaled 129. Although the various sampling regimes were to be placed individually in the field, the field personnel actually superimposed all five strategies by swinging each of the three basal area factors on every plot. The mix of count plots versus grade plots by BAF for each of the sampling strategies was then accomplished in the office. MAPPING As part of the project, stock aerial photography flown on July 14, 1994 was obtained and a preliminary map of the property was developed. The property was then visited and a brief field inspection was conducted with the owner. Since some of the property had been harvested since the 1994 aerial photos were taken, a new set of aerial photos was flown contemporaneously with the fieldwork. Nineteen (19) GPS control points were established on or in the near vicinity of the property using a Trimble Pathfinder Pro XR. Utilizing the GPS data in an AP 190 analytical stereo plotter, the photos were corrected for distortion and a type map was created. This provided a sound basis by which the cruise data could be extended. RESULTS & DISCUSSION Cruise data were compiled and extended for each of the sampling strategies using a common computer spreadsheet program. The results are shown in Table 1, and in Graphs 1 and 2. Sample #1 (Walker 40) is the standard by which the other four samples are compared. Table 1.
Results from Sample #1 (Walker 40) and Sample #2 (Walker 80) were nearly identical. This comes as no great surprise since both methods have the same basal area sample and the same number of tree volume samples. The only difference was in the distribution of the volume samples. Volume trees for Sample #1 (Walker 40) were clustered on every other plot while Sample #2 (Walker 80) trees were dispersed over all of the plots. One purpose of this exercise was to determine if a smaller sample would result in an overall acceptable answer. Samples 3, 4 and 5 address this issue. In each case a larger standard error percent was obtained. This was, of course, expected. Net volume differed from the standard by 2 to 7%. Total dollar value varied from less than 1% to approximately 4%. The most distinctive differences are the loss of minor species and a shift in export to domestic grades for Douglas-fir. This can be attributed in part to: 1) the very small number of minor species (estimated from two to four grand fir per acre); and, 2) export grade volume is a minor component much like the off-species. Graph 1.
Graph 2.
In addition, a better grade distribution was explored to test its effects on cruiser production. This was effectively tested in Sample #2. Although a formal time study was not undertaken, the cruisers reported that there was no apparent productivity loss associated with the broader distribution of sample trees. The findings in both cases are positive and consistent with the underlying theories. Of particular interest to us was Sample 4 (Walker 250). This system sampled basal area on every plot using 40 BAF. Volume trees were sampled on every other plot using 250 BAF. This resulted in only 42 trees being sampled – an 80% reduction as compared to the standard. Even with this drastic reduction, the sample yielded a total value of 99.7% of the standard and only a small increase in standard error percent. Graphs 1 and 2 present a pictorial view of the results. Examining Graph 1, the horizontal bars depict the range in net volume and dollars at a 95% confidence interval. Graph 2, following, is an alternative way of visually presenting the data for net volume. In both graphs, the sampling methods with the more intense basal area sample (#1 Walker 40 - #2 Walker 80 - #4 Walker 250) reflect a more precise result as measured by sampling error for both volume and dollars. |