Questions from the field...
How do I choose the frequency of for sample trees with different strata or products ?
We have sent out suggestions for how to choose sample VBAR trees in the past. http://www.proaxis.com/~johnbell/iitt/questionsftf_online4.htm
The USFS uses the randomized selection method. This has the advantage of choosing different species or product groups as if you were carrying many angle gauges and doing BIG BAF sampling (except that the trees are not quite as close to plot center). There is no problem with this form of selection.. This question recently came up at a short course in Kentucky:
How do I choose the frequency
of for sample trees
with different strata or products ?
To find the right selection ratio (1 in 15 trees, for instance, vs. one in 5) you can use the EXCEL program here on the website called “STARBAR” (for */BAR, because it can be used with any conversion ratio on sample trees, not just Volume/Basal Area Ratio). This same approach can be used for fixed plot subsampling, and “1 in X” sampling for trees.
You need to know the CV’s you are dealing with, from past records, a preliminary cruise, or perhaps you can just estimate it. One estimate of the CV for Tree Counts of minor species (by their % of the stand basal area) is discussed here :
http://www.proaxis.com/~johnbell/regular/regular67b.htm
Entering the data and getting the result
If you don’t have any preference, put the cost of TC or VBAR tree measurements as “1” in cells E3 and E5. An example is shown after this discussion.
Put in the CVs for the TC and VBAR in cells C3 and C5. You can put the value for what you want for a sampling error of 1 SE% (t=68%) in Cell D9.
If you want a 95% confidence level, just put in ˝ of what you want (for SE%=40% @9 5%, put in 20%, which is one SE%). This SE% will not really change the ratio, whatever you use.
Put the expected TC for that particular species, product, strata, or whatever you are working, with into Cell I15.
The ratio of trees you want to measure when they are found by the angle gauge at any point is given in cell I8.
As an example, TC CV=200%, VBAR CV=20%, average count for that species on a plot is 0.5 trees/plot. This yields a rate of 1 in 5 counted trees to be measured.
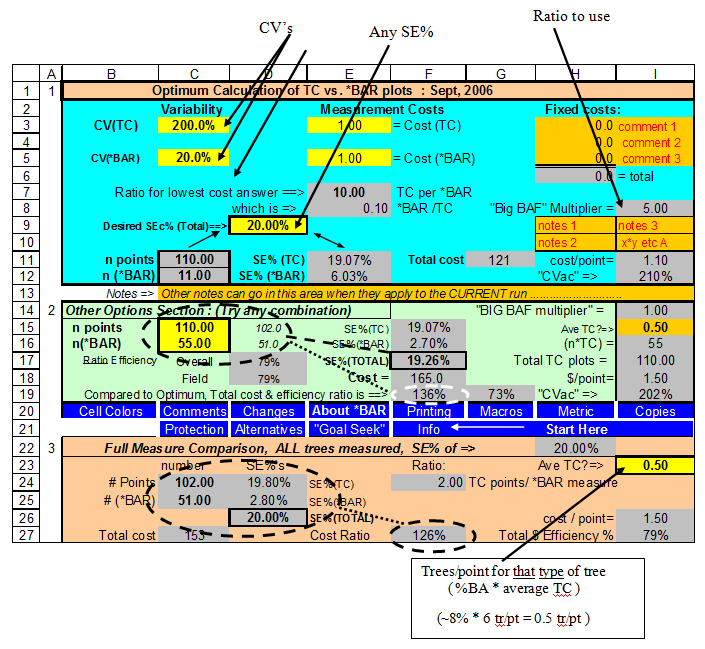
You might also note that if you measured every one of that species (110 counts, 55 trees) you would drop the combined SE% trivially to 19.26%, with 36% more field time.
If you adjusted the count and measured to get 20% exactly, while measuring all “in” trees, to 102 and 51, you are still wasting 26% of your field work (you should have been doing more counts instead of wasting time on the extra trees).
On the other hand, perhaps this kind of wasted effort is having such a good psychological effect (“hey boss, I am measuring all of the rare trees”) that you might do it for that reason. It is a cost aimed at a false comfort, to be sure, but you cannot completely discount the psychological effect of that (if you have the book A Sampler of Inventory Topics, see page 231).