Questions from the Field:
The SE% is not small enough. Now What?
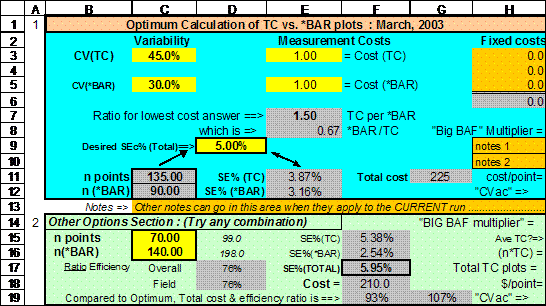
Bill from the BLM posed an interesting question. He did a VP cruise, and the result was not good enough. Assuming 70 counts at sample points, and 140 measured VBAR trees, he might get the following results as an example:
TC CV= 45% SE%= 5.4%
VBAR CV= 30% SE%= 2.5%
Combined SE% = 5.95% ( @t=1, or the 68% level )He wanted a 5% sampling error. He already has too good an answer for VBAR, so what should he do? He correctly guessed that he needed more tree count points, and just needed to add them on a new grid over the area. But how many Tree Count points does he need? These calculations can be a hassle. This is a perfect use for the Star_bar program. Download it, and take a look.
Looking at the “other options” section in that spreadsheet, you can put in a trial number of TC plots and VBAR measurements to see the resulting combined error. Enter 70 plots and 140 VBARs in cells C15 and C16. As you can see, this does not give you a 5% sampling error, and more measurements are needed. Now you can use the “goal seek” tool to solve the problem.
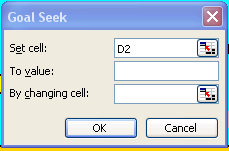
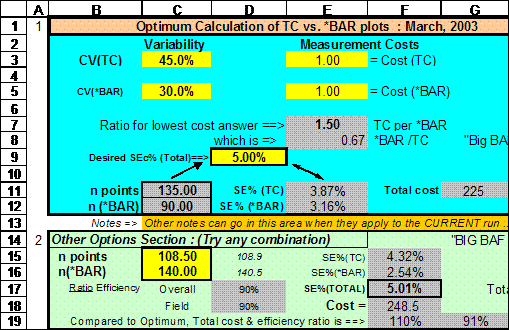
Select (Tools/Goal Seek) to bring up the box for entering your requirements. In that box, set Cell F17 to 5% by changing cell C15, and the spreadsheet computes that you need a total of 108.5 tree count plots with the same number of VBARs you already have.
Since you already have 70 counts, all you need is about 40 more count plots to get the 5% goal. Just to be safe let’s make it 50 or 60 extra count plots, because we don’t want to go out there yet again. These count plots will also help out your species percent calculations.
Is there any other choice? Well, there is another option, but it is not a sure winner. Making the rest of the cruise a different strata after we saw a problem developing during the cruise, then pumping up the number of plots in that second strata might have worked - but it is messy to calculate and you don’t really know the CV’s for the unmeasured half anyway. If you cannot revisit the area already cruised (due to logging, for instance), using a second strata might be the only option. Essentially this is a second cruise where the combined SE% for the two cruises added together is 5%.
All things considered, the best choice is to just live with the 6% sampling error, but if you can’t do that (legislation often gets in the way here) then this simple spreadsheet calculation is a good option to solve the problem using inexpensive count plots. The spreadsheet also reveals (Cell F19) that this process was very close to an optimum solution – other than revisiting the area twice.
It’s a quick and simple fix to a common problem.
Originally published July, 2007