Sampling from a List - a Big ImprovementOne of the guest articles by Norm Marsh (newsletter issue #40, 1997) talked about "sampling from a sorted list." It might be useful to talk about how to do the mechanics of this kind of sampling, because it is so very efficient. By efficient, we mean that you get a much better sampling error. In addition, you sample a very good cross-section of the population, and therefore get a better description of it. Systematic Samples are common in forestry. A "square grid" of plots is one example. The operational reason to do a grid sample is that it is handy for plot location and navigation. It also looks convincing. A grid is only one kind of systematic sample. The statistical reason for systematic samples is that they give better answers than random samples. How much better depends on how cleverly you do the systematic design. It might be that nature gives you a nice gradient to sample across, like the increased volume/acre up and down a slope for instance. If nature does not give you a nice gradient, you can create your own. Suppose you have just taken over a company with an out-of-date inventory. You want to do your own measurements on the stands. A sorted list is one good way to do the selection of stands to measure. Even though you would have hundreds of stands, we will illustrate the idea with an example of only 20 stands. The actual measurements are also listed in the table (in case you want to do a sample for yourself), but of course you would only know those measurements when you sampled that stand. One thing to note is that we are simply putting these stands into order from smallest to largest. We do not really need to give them values. The old estimates for the stands are just a convenient way to get them listed from smallest to largest volume/acre. There are several statistical techniques that make use of your estimates when they are actually numbers, but this method only needs the approximate order of stands from small to large. You cannot cause a bias by how you sort the stands, so the order is completely up to you. Some people might prefer to sort them by age, for instance, so that they get a very good distribution of ages. If they used strata, they might want to sort by age within that strata. The main distinction between different sorts is how efficient they are at estimating the total or average. After sorting, we specify a range for each stand, depending on its area. This will give each acre in the ownership the same chance of being sampled (and every stand has a probability of sampling proportional to its size). This is the same probability that a simple grid or random sample of the area would give. The total area in all the stands is 1,093 acres. If we want a sample size of 6, we will select a stand every (1093/6)=182.17 acres. The first selection is chosen randomly between acres 0 and 182.17. This is called a "random start" for the sample, for example it might be acre number 57.55. From then on the constant amount of 182.17 acres is added for each additional sample location. This gives the following sample of 6 stands to measure :
The stands these acres fall into are noted with an asterisk (*) in the table below. These identify the stands to sample. As you can see, the larger stands have a larger chance to be sampled. A very large stand might be sampled several times.
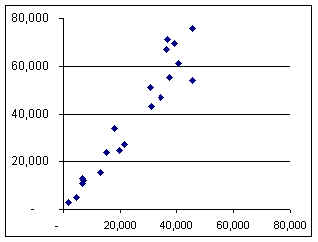
As you can see, there is a rough relationship between the estimate and the possible new measurement, but there is considerable variability, and the new values are about 55% higher. A graph also shows this :
This systematic sample across the sorted list forces a "good" sample, where the large and small amounts balance each other better than a random sample would do. It maintains exactly the same probability for each stand that a random sample or a grid of plots would provide. It is the combination of stands that is controlled for any 6 observations, and which improves the result. The better the job you do getting the list into the right order, the better the sample will balance internally to provide an improved average. In this example, a simulation indicated that a random sample of 6 would give a sampling error of about 23%. A sample of size 6 from a sorted list gives a sampling error less than 9%. This is about 7 times as efficient (in other words, the systematic sample of 6 is equivalent to 42 observations with a random sample). You do not get this advantage for free. You get it from your ability to put the stands into roughly the correct order. The payoff is due to your effort. When nature has not put stands into a trend (such as up and down the slope) we can create a trend to sample across. Even when you are doing more sophisticated sampling methods, this technique of using a sorted list can insure that you have a good coverage of the population. When you do the usual sampling error calculation with a systematic sample, it does not seem as if you are getting this advantage. This is because you are using a formula that assumes a random sample was used. If you want full credit for your systematic sample, you should calculate the sampling error with a different process. The simplest way to do that is to take several systematic samples and compare the averages of each of them directly. Here, for instance, is the result of 3 systematic samples of size 6 (each with a different random start) using our example population, for a total of 18 plots.
Using these 3 observations, we get one Standard Error of ±4.9% (including multiplying by 1.1, the t-value for a sample size of 3 @ 68% confidence). With the usual computation, the Standard Error would be about ±15%. You would require about 160 random plots to get an SE% of ±4.9%. Being able to document this improvement is a big payoff for doing the extra work of setting up 3 random starts. You get the benefit from a systematic sample whether you calculate it or not. Many people are content just to know that they are getting a better result. Kim Iles |
 The average for this sample is 39,377 BF, which
is a 57% increase over the old estimate of average volume/acre.
The average for this sample is 39,377 BF, which
is a 57% increase over the old estimate of average volume/acre.