First Aid for Cruises (Part I)David Marshall, USFS PNW Research Station Two of the most frequent questions we get at workshops are:
In this two part series we will discuss several very typical problems that occur after a cruise has been completed and what you might do about them. We will also refer to some earlier articles that discuss in more detail parts of these issues. Two situations we discuss are when:
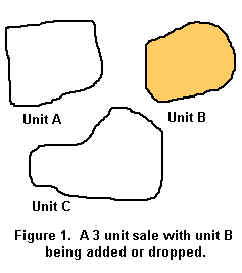
For each situation we discuss what can be done for plots (fixed or variable plots) and for 3P cruises. Some solutions we propose are correct and defendable in every case, but others require making some assumptions. In most situations these assumptions are probably not a problem, but the actual consequences may not be known for a particular cruise. An important question to ask before applying any correction to a cruise is, “How good an answer do I need?” Many “fixes” will add some sampling error. There are some situations where redoing the entire cruise may be the best alternative in the long run. In other cases, the problem can be solved by the following methods. Problem: “I cruised the sale area and everything turned out fine. Then the boss wanted to drop this little part of the area from the sale.” This can be frustrating, and a difficult problem to deal with. For now, we will assume that growth in the stand is not an issue. We will discuss the growth problem in the second part of the article. In most cases (unless the conditions are very uniform) it is not appropriate to just reduce your answer proportional to the change in area. Are you really sure that the area removed had exactly the same average as the whole area? Areas are often deleted because they are slightly different in some way. First – the easy case. If the sale includes several distinct units and one of the units is being entirely dropped (see Figure 1), simply drop the unit and any measurements in it, then recompute the cruise.
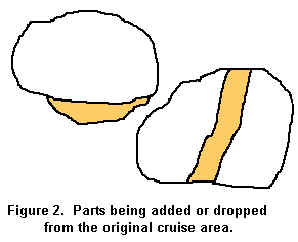
For a plot cruise, this means dropping the plots in area “B.” For a 3P cruise, throw out the sum of the estimates for the dropped area and the ratios for any sampled trees in that area. One problem that can result from this is that you don't have enough observations left to meet a desired Sampling Error (see "Questions from the Field”, Issue No. 11). Our first reaction is, “can you live with it?” Remember that if you have done things correctly the new result will still be unbiased. The Sampling Error is just a bit larger – who cares? If you cannot live with the larger sampling error you can usually add additional measurements. If it is a plot cruise you can put in additional plots of the same type (they must cover the entire remaining cruise area) then recompute. For a Variable Plot cruise, you may only need to put in count plots in order to reduce the total SE. Tree counts are usually more variable than VBAR, and are usually under sampled in relation to their variability (see “Count Plots in Prism Cruising: A Simple Money Saver,” Issue No. 4). If it is a 3P cruise that needs more measurements and you had selected “insurance” trees at the time of the original cruise, you could revisit some of these trees (randomly or systematically), measure them to get additional ratios, and recompute the cruise with this larger sample size (see “How Would You Choose Extra Trees in 3P Sampling?,” Issue No. 37). What if the area you are removing is part of a larger contiguous area? (Figure 2, shows this situation) An example could be a riparian strip that must be removed due to changing rules. For a plot cruise this is not an easy problem. One idea would be to drop the affected plots and recompute the cruise with the plots remaining in the new area. This works if you can correctly identify where the plots fell, and if you know what trees should also be removed because they were in the riparian zone (even though the plot center was not).
If you are not sure which area the previous plots and trees fell into, there is another option. You can recruise only the dropped area, and subtract that estimate from the overall total. The corrected total can be computed as: Remaining Total Volume = Original Volume – Removal Volume For the Combined Standard Error: SEremaining2 = SEoriginal2 + SEremoval2 Note that the SE here is in UNITS, not percent, and is the TOTAL SE for the entire area (not per acre). The cruise of the removal area can also use a different method, such as 3P, with the two estimates being combined in the same way. These are two independent cruises, so they do not have to be done with the same methods. This is a great use for 3P cruising, especially if the areas are small or narrow strips (or any similar method to 3P where each of the trees are visited and some are measured). What if the original cruise is a 3P cruise? If the area in question is delineated by a strip or multiple strips, you can drop the strips in question and recompute the cruise. This means reducing the total sum of the KPIs by the amount in the strip(s) and also dropping any measured trees in the removal area before you compute the new ratio. If the area dropped is small compared to the whole area, using the same ratio would probably not be a big problem – but it’s not a great idea. What if the area being removed is not defined by a strip, or you don’t know the sum of the KPIs for the strip being removed? In this case you can revisit the area to be removed, re-estimate the KPIs for those removal trees, then subtract that amount (out of the total of all the KPI values) before you adjust by the average ratio. The problem with this is that you may be estimating in a different way during the second visit. To be perfectly correct, you can just do a separate 3P sample of the removal area, and subtract it from the total as we have already described. The opposite problem is adding areas into a cruise. This is generally the easiest of the problems to handle by cruising the new area and adding it into the original (like a strata). The new cruise total is computed by: New Volume = Original Volume + Added Volume New Standard Error: SEnew2 = SEoriginal2 + SEadded2 Here again, this SE is in UNITS for the total area. This will work for either plots or 3P cruises. As you can see, the total SE will increase, but the SE% will probably drop. This is because the total is increasing even faster than the SE. The two cruises (original and added area) do not have to use the same method. As with deleting areas, if the added area is small or narrow, plot cruises will have problems with edge effects, and a 3P cruise may be a better alternative. Is it OK to just cruise the new area the same way as the original area, add the new plots and recompute it as one large cruise? Yes it is -- if the same methods and sampling intensity are used. If a different BAF (or plot size) is used, or a different intensity of plots/acre is put in, the plots will need to be weighted to get the right volume and Sampling Error. You can always combine these as two different cruises, as described above. If you are extending a 3P cruise, the simplest route is to use the same random number tables and estimators to insure the same selection intensity for measured trees. If you can’t use the same estimators, you should handle the new area as an additional cruise. In textbooks, combining several cruises will be described as “combining strata.” In the second part of this article will discuss the problem of adjusting a cruise if growth has taken place after the sampling was completed. |