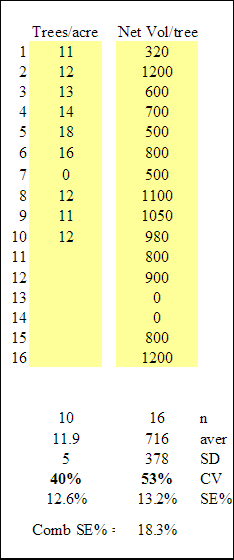
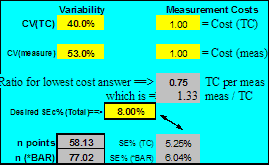
Subsampling Fixed PlotsThere is nothing wrong with Fixed Plots. They are easy to understand, which is a big draw for many people. The problem is that they take so much time, and measure so many small trees. As measurements people expand their work to sampling all kinds of biological information, Fixed Plots are often a good alternative. The principles discussed here apply equally to rocks, ferns, trees, or anything else you might need to sample – not just the trees we will use as an example. If you measure all the trees on a plot, you can calculate two things. First, volume per acre. Second, the volume per tree. If you choose the second option, it gives you the choice to use count plots for the number of trees. One simple way to do this is to use small Fixed Plots for the measured trees, while counting just the number of trees on a larger plot surrounding the point. Process the data through your regular compiler to find out the average volume per tree by each species. Many small plots cover the area better, and the measured trees are closer to you. This method should particularly improve your volumes of rare species, just like count plots do in Variable Plot Sampling. Some people would prefer to only count the rare species on the count plots. On the count plots, just tally the trees by species. This will estimate how many trees there are per acre. This process should be quick, but just like Variable Plot sampling you have to check the borderline trees or do something to show that your counts are reliable. The plot size and visibility through the brush must allow you to do the work reliably. Lasers are wonderful instruments, and partly solve the distance problem, except that they shoot to the front, rather than the center of a tree. At best, they will allow you to count without leaving the plot center. At worst, they go a long way to solving the Fixed Plot problem of counting the right number of trees, particularly in open country. Split image Range finders will measure to the side edge of the tree, and that is essentially the same as to the center of the tree. Of course, you can just put in extra plots of the same size for your counts. Do whatever is easy for you in the field, and will give good quality control to the process. At the end of the cruise, you simply multiply the average number of trees/acre (from all the plots) times the average volume/tree (or other measurement/tree) from trees in the measured plots. This will give you the total volume/acre. There is no problem if you do not get one tree of each species on each of the small plots, but you do need at least one tree of each species at some time in the cruise. As in other sampling situations, perhaps you should take the first instance of any rare species, even if it is on the count plot, and drop it when you have an actual sample appear. You have two Sampling Errors to combine. The easiest way to do this, and a quite reasonable estimate of the combined Sampling Error, is with "Bruce's formula". SE% : volume/tree = 13.2% As in all such situations, the balance of what to do is proportional to the CV's of the things you are measuring. With: You need about 53 trees measured for every 40 counts that you make, so about 1.3 measured trees per count plot would be about right. You could choose those trees on plots 1/11 as large as the count plots1 and centered on the same point, or you could measure all the trees on every 11th plot. As in Variable Plot sampling, spreading the trees out is statistically more efficient than taking them in large groups. You can also get fancy and include the time for each type of measurement using the STAR_BAR program. In the case of sampling something other than trees this can often be important. Using STAR_BAR, if the effort of counting and measuring a tree is about the same, you need about 58 counts and 77 measured trees to get an SE% of 8%, as shown on the next page. An example of these spreadsheets can be downloaded HERE. 1Calculate by : {(53/40)/15} = (1/11) NOTE: We would be interested to know how many of you are using Fixed Plots on a regular basis, why you do that, and what problems or solutions you consider important. Drop us a note on the website.
11.9 trees * 716 per tree = 8,516 per plot
|

