by Kim Iles
Many practical cruisers prefer to sample a ōrectangularö grid, for efficiency of movement in the woods. There is nothing wrong with that, and there are some advantages in comparison to the ōsquareö grid where plots are an equal distance apart horizontally and vertically. The use of a ōhexagonalö grid is uncommon, and not much of an advantage in any way that I can imagine. Random plot locations are a hassle (and give a more expensive and less reliable answer), so only researchers would normally consider it.
For legal presentation or contentious situations, I always prefer a square systematic grid simply because it is so visually persuasive. In these situations, credibility is at a premium. A rectangular grid is efficient for moving through the woods, and similar to the old idea of a ōstrip plotö that was used for so many years. You can get several times as many plots on a line of travel, and the advantage is obvious. Research many decades ago showed that a line of plots matched very well with the random sample equation that we always use for Sampling Errors. They lost a bit of efficiency with the closer spacing along the lines, and gained the same amount back by using a systematic sample.
What if the lines all fall on features like ridges? It virtually never happens, is hard to even arrange, and when you chose a random angle for the lines to run it is virtually impossible. People worry about this kind of thing all the time, but the same is true of a square grid ¢ what if they all fell on the same kind of place? Actual examples of such a thing are entirely missing in the real world. You can always choose the orientation of the lines so this will not happen. By the way, who ever worried about it happening with random samples? It is a non-issue (please send us an aerial photo and the data if it ever think it happened to you, and we will make you a star).
How about the best of both methods? We can put in a square grid of ōMeasure plotsö that some people still use (although I prefer one of the forms of ōBigBAF cruising) then put count plots in between the measured plots along the line of travel. When you are done with the process, you can look at the average tree count for the rectangular grid versus the square grid of only measure plots. When no differences are seen, people will stop worrying about it before too long. Our friend Norm Marsh, one of the best cruisers around, has used this method for years ¢ although he is now moved to using BigBAF plots all along the lines. His opinion is not to be taken lightly.
In British Columbia, where the plots are often taken on a 100 meter spacing (5 chains apart). You could move along the line between Measure Plots, dropping count plots every chain with just a count by species. The travel time is nearly the same, but a lot of extra information is gained, as long as tediously marking the count plot locations does not take a lot of time. The simple check already mentioned should satisfy everyone that nothing is going wrong with these intermediate plots.
I would suggest putting the extra plots just along the major lines, rather than connecting up the lines with a few extra plots as you move over to the next line. Those connecting plots would tend to be on the outside of the stand, and even if they did not actually cause a problem I suspect that people looking at the map of the plots would be concerned. The number of extra plots is probably not worth the extra concern.
Example - Measure plots with 3 Count Plots between them.
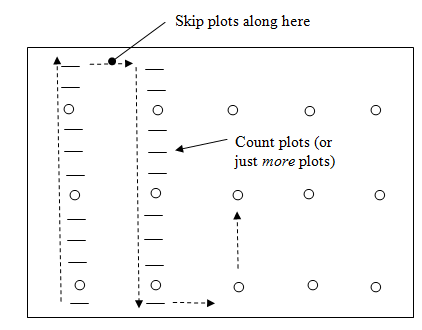
In this example, you could just think of these ōextra plotsö as the same grid that the circles make, repeated by shifting it North 3 times. Each of these sets is one of 4 square systematic samples.
How do you start the lines? The best way is to choose a random point in the area to be cruised, and run the first line through that point, repeating the lines out from there. You might also use a random angle for the lines. With GPS waypoints, plot-to-plot navigation is becoming increasingly simple. The use of a ōbase lineö for establishing the first line is a bad idea in most cases, whether you are using one line or several.